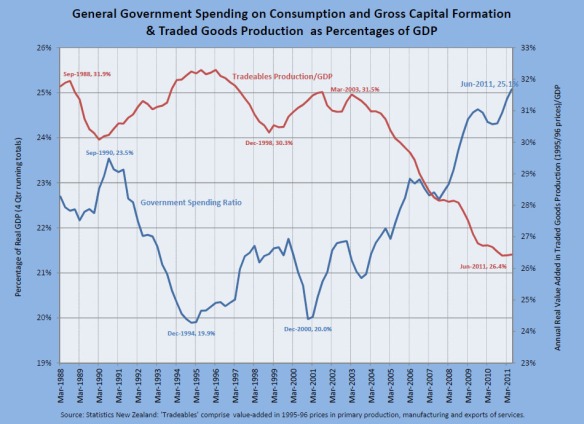
This Friday’s graph uses Statistics New Zealand’s just-released real GDP figures for the June Quarter to compare the rise in general government spending on goods and services (current consumption and gross fixed capital formation) as a proportion of GDP with the decline in the contribution of the production of traded goods in GDP.
According to one prominent line of economic reasoning, if government spending is predominantly focused on non-traded goods, a rise in such spending can be expected to reduce the competitiveness of the exposed sectors of the economy (ie firms that are exposed to international competition), thereby worsening export performance. The chart is suggestive in this context.


Pingback: Friday Graph: Public Sector Wage Rates Holding Gains on Private Sector | Policy Matters