Last week’s chart showed what a strong net public debt position New Zealand is in, compared to Italy and most other OECD countries.
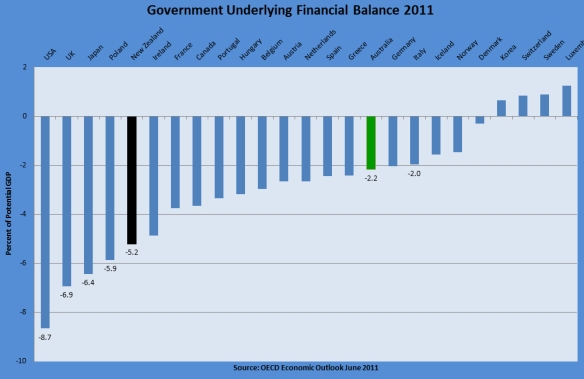
This week’s chart shows that New Zealand is running one of the largest underlying fiscal deficits in the OECD, as a percentage of GDP.
Specifically, New Zealand’s cyclically-adjusted financial balance for 2011 is projected to be minus 5.2 percent of GDP, which is the 5th highest deficit in the OECD, far higher than Australia’s and makes Italy today look like a model of fiscal prudence compared to New Zealand! For 2012 New Zealand’s projected underlying financial deficit of 5.4 percent of GDP would be the 3rd highest in the OECD.
Much the same rankings for New Zealand for 2011 and 2012 apply for the OECD’s other financial balance indicators – the cyclically-adjusted balance (fourth in both years) and the primary balance (second highest deficit in 2011, no doubt in part because of the Christchurch earthquake, and third highest in 2012).
New Zealand’s underlying fiscal deficit problem arises from the spending excesses post-2005, and the unwillingness of the current government to address the problem more decisively. The latter issue is of particular concern with the government lacking the political will to implement even such obviously necessary measures as eliminating interest-free student loans and raising the age of eligibility for New Zealand Superannuation.
