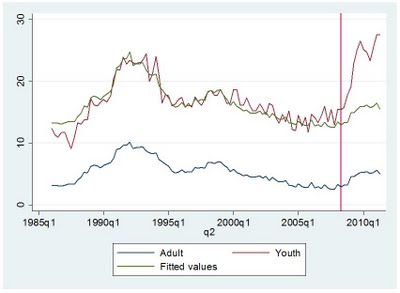
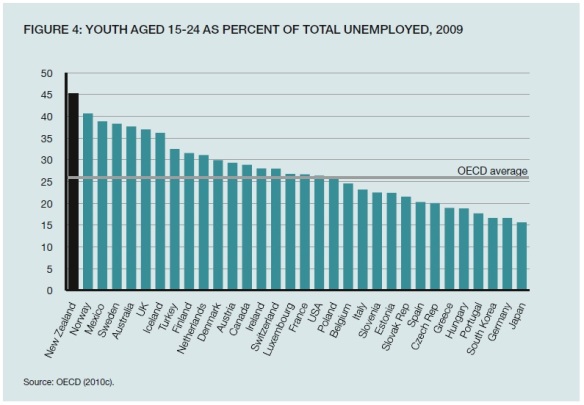
This graph from a 1 July 2011 Wall Street Journal article tells a familiar story.

The article explains that:
This is a rotten summer for young Americans to find a job. The Department of Labor reported last week that a smaller share of 16-19 year-olds are working than at anytime since records began to be kept in 1948.
Only 24% of teens, one in four, have jobs, compared to 42% as recently as the summer of 2001. The nearby chart chronicles the teen employment percentage over time, including the notable plunge in the last decade. So instead of learning valuable job skills – getting out of bed before noon, showing up on time, being courteous to customers, operating a cash register or fork lift – millions of kids will spend the summer playing computer games or hanging out.
The lousy economic recovery explains much of this decline in teens working, and some is due to increases in teen summer school enrollment. Some is also cultural: Many parents don’t put the same demands on teens as they once did to get out and work.
However, there is more to the story:
But Congress has also contributed by passing one of the most ill-timed minimum wage increases in history. One of the first acts of the gone-but-not-forgotten Nancy Pelosi ascendancy was to raise the minimum wage in stages to $7.25 an hour in 2009 from $5.15 in 2007. Even liberals ought to understand that raising the cost of hiring the young and unskilled while employers are slashing payrolls is loopy economics.
As always, such minimum wage increases hit disadvantaged groups hardest:
Black teens have had the worst of it, with their unemployment rate rising to 41.6% in April from 29% in 2007, faster than almost any other group. A 2010 study by economists William Even of Miami University of Ohio and David Macpherson of Trinity University found that as a result of the $2.10 increase in minimum wage, “teen employment dropped by 6.9 percent… For the teen population with less than 12 years of education completed, teen employment dropped by 12.4 percent.” For teens priced out of the labor market, their wage fell to zero.
All this mirrors New Zealand’s experience in first increasing youth minimum wages and then abolishing them altogether. It has been estimated that these moves have cost around 10,000 jobs for young people.
Note too that the current US minimum wage is US$7.25 an hour or under NZ$9.00. Our current minimum wage is $13.00 an hour, a ludicrous level for a country that is far less wealthy than the United States.
Why former Green MP Sue Bradford has not been pilloried for her ignorance or wilful blindness about the impact of abolishing youth rates, and why the government has not moved to reinstate them, is impossible to fathom.


