Treasury Secretary John Whitehead has given two informative speeches this month (here and here).
A pleasing emphasis in them is the urgent need to switch resources from the non-traded goods sector of the economy to internationally competing industries. With its high levels of foreign debt arising from successive current account deficits, New Zealand is exposed to external economic shocks.
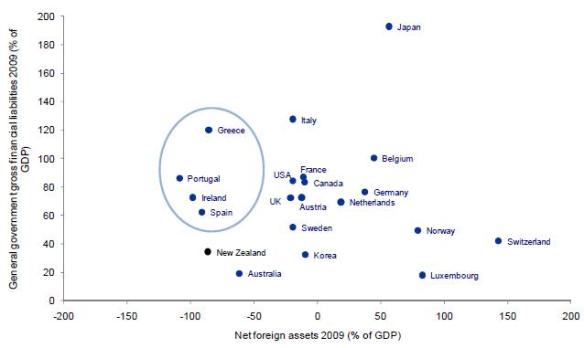
Finance minister Bill English has been emphasising the need for economic rebalancing in the light of the trends illustrated in this familiar graph used by John Whitehead.
Click to enlarge

This emphasis was not a feature of earlier Treasury advice, for example its briefing to the incoming government in 2008. Like former finance minister Michael Cullen, it primarily associated the current account deficits with allegedly low national savings rather than a combination of factors relating to competitiveness and the extent of overseas ownership in New Zealand. .
So a bouquet for this new emphasis.
But the breakthrough is only a partial one. This chart used in John Whitehead’s 18 November speech, which purports to show what “we have been consuming” relative to the “income that we have been generating”, is misleading.

In the conventional ‘Econ 101’ chart, point B shows domestic spending on capital and consumption goods and services. When such spending exceeds the local supply of these goods and services, the deficiency must be met from an excess of imports of goods and services over exports of goods and services.
It follows that it is wrong to describe point B as a point at which ‘we have been consuming’. Instead it is a point at which residents and non-residents (such as foreign-owned firms in New Zealand) have been spending in New Zealand.
To describe point B as being a point of consumption and to position it above the point of production or income (point A) invites the unwitting reader to infer that New Zealanders have typically been dissaving. This is not the case. National savings have been positive annually, with very few exceptions.
But as it happens, contrary to the representation in the diagram, point B has not been above point A on average for at least the last 20 years. A glance at this graph shows that on average over the period the value of exports of goods and services has marginally exceeded the value of imports. This implies that on average in this period point B on the chart has been below point A, not above it.

Or to put it another way, gross national spending has on average been less than gross domestic product.
Instead the largish deficits in the current account of the balance of payments in the last 20 years have been primarily associated with a highish proportion of New Zealand GDP that belongs to foreigners (through direct and indirect investment). This gives rise to the gap between GDP (the income generated from production in New Zealand) and GNI (the gross national income accruing to New Zealanders.
This second chart indicates that this gap between GDP and GNI opened up markedly in the early-mid 1980s when the cumulative effects of heavy overseas borrowing following the 1973-74 oil shock, the 1984 currency devaluation and the realisation of heavy taxpayer losses on guarantees for major projects all came to a head.

Of course these two charts do not constitute a thorough analysis but they raise questions about the quality of the Treasury’s assessment of the issue.
Other aspects of the Treasury’s analysis of savings and current account issues were criticised in this Business Roundtable submission to the Savings Working Group.
Misdiagnoses of economic issues matter because they can lead to bad policy, such as the savings interventions of the last government.


