A CHANCE TO CHOOSE

Following the February earthquake, some Christchurch schools have been ‘hot desking’ at other schools, including Shirley Boys High School at Papanui High, and Avonside
Girls at Burnside High.   Although no doubt challenging and disruptive for all involved, it’s one of many innovative solutions Cantabrians have come up with to cope with the disaster.  Earthquake aside, making more efficient use of all existing school facilities would make a lot of sense.  Running two shifts at schools could also provide much greater flexibility for teachers and students.

Now the Christchurch City Council is considering removing school zones for central
Christchurch residents as part of a plan to encourage families to live in the central city.  While the proposal has been seen by many as an interesting idea worth considering, much concern has been expressed about the impact it might have on ‘popular’ schools and the pressure it would place on their rolls.

As Shirley Boys High School principal Peter Laurenson said in The Press:

“Look at a school like Burnside. If they suddenly had an extra bunch of people who were qualified to go into the school, they could have so many children in the school that they couldn’t place them.”

True.  So does that mean those in the zones of unpopular or inferior schools should just have to stay and put up with them?  Instead, why not consider letting a popular school like Burnside set its own roll limit to fit its facilities and, if it chooses, take over the property and facilities of one of the ‘unpopular’ schools, and create a second campus with all the elements that has made Burnside so successful?

Freedom to allow schools to open, expand and close in response to demand is one of the three key features of successful school systems (such as Sweden’s) that allow parents and students to choose the school that best meets their needs.  In New Zealand, however, the Ministry of Education has always been reluctant to open new schools when there is spare capacity in existing ones nearby, or allow failing schools to close.

The key
features of school choice are set out in the Education Forum publication School Choice: The Three Essential Elements and Several Policy Options by Stanford University Professor Caroline Hoxby, along with clear empirical evidence of the benefits of such systems, especially for disadvantaged children.

The other two key elements are: having the funding follow the student, thereby ensuring
all schools are on the same footing; and independent management that frees schools from bureaucratic micro-management, and union interference, and allows them to innovate in teaching practices, pay, curricula and school organisation, including the length of school days and years.

Mr Laurenson was also concerned about the gap between students from within the zone and those who came from elsewhere:

“Suddenly you’ve got part of a school zone that has no physical or geographical relationship with the school.”

Not a strong argument.  As commenters on The Press article affirmed, plenty of children travel well out of their neighbourhood to attend their chosen school, especially the children of the better-off who can afford to bypass a failing local school and send their child to an independent school.  Some are so determined to get their child into a ‘good’ school they’ll even upsticks and move into its zone.  As families living in Epsom would report, the impact on local real estate values is obvious.  No doubt those in Burnside’s zone feel the same effects.

Christchurch has a chance now to be a trail blazer and give its citizens, especially those
from the city’s shattered Eastern suburbs, a chance to choose their children’s schools.
What could be bad about that?

FRIDAY GRAPH: NEW ZEALAND UP THERE WITH GREECE?

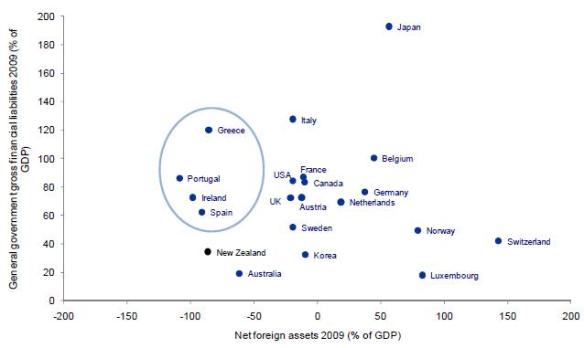
This chart is enough to keep you awake at night.

Source: OECD, IMF, Statistics NZ, Savings Working Group 2011

The Y-axis shows government financial liabilities.  New Zealand is not badly placed, thanks to many years of fiscal surpluses which ran down government debt (before the return to large budget deficits which began under the last Labour government).

The X-axis shows net foreign assets (as a % of GDP).  At around -90%, we are in the same category as the PIGS (although more of our liabilities are in the form of equity, which is a positive factor, with foreign investors – including dreaded multinational companies – bearing some of the risk).

Behind this exposure are the large current account deficits of the Michael Cullen era.  He wrongly diagnosed them as a savings problem, rather than a problem of declining international competitiveness.

The CAD has subsequently narrowed but rebalancing of the economy has a long way to go, and the government is forecasting large deficits to re-emerge when the economy picks up.

All this matters because things could turn ugly for New Zealand in global financial markets, with access to credit being limited again (as it was during the GFC) and our credit rating cut.  Prime minister John Key is right to be clamping down on government spending to try to avert this outcome.

FRIDAY GRAPH: THE SPRAWLING BUREAUCRACY

A picture can tell as much as a thousand words. Here is a chart from a talk given by Andrew Kibblewhite, deputy chief executive of the Treasury, to the Institute of Policy Studies on 1 April this year.

 In Mr Kibblewhite’s words, “This chart underscores just how comprehensively our small country has divvied up our state sector into a clutter of agencies.”

The government has embarked on some restructuring and mergers, but in my experience the gains from such efforts over the years have not been great. An article in today’s Business Herald suggests we may be seeing the same thing this time round. It reads:

The merger of the Department of Internal Affairs, National Library and Archives New Zealand; the coming-together of the Ministry of Agriculture and Forestry and the Food Safety Authority; and the merger of the Ministry of Research, Science and Technology  and the Foundation for Research, Science and Technology have gone relatively smoothly. The $24 million in savings over four years was originally going to be offset by some $11 million in transition costs. Now, though, the agencies have had to find another $8 million in capital expenditure from within their balance sheets to “provide the necessary infrastructure and capability” – much of which can be translated as “none of our computer systems will work with each other”.

Two things in my view are much more important than rearranging the bureaucratic furniture.

The first question that should be asked is whether we need parts of the furniture at all.
On coming to office John Key as minister of tourism abolished the Ministry of Tourism.  Has anybody noticed or cared?

Second, instead of focusing on restructuring the bureaucracy (often by establishing advisory groups of bureaucrats), the government would do better to focus on leadership by top quality CEOs. Numerous appointments in recent years have been unimpressive, and there has been little sign of the State Services Commission moving poor performers on. The government would find that top CEOs would solve many of the problems of bureaucratic sprawl and inflated headcounts by themselves.

FRIDAY GRAPH: PRIVATISATION

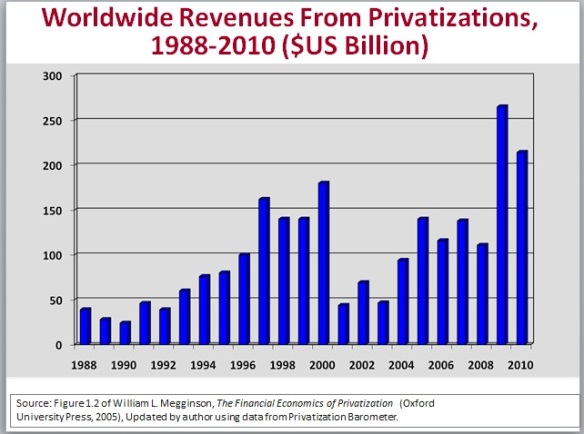
This chart comes from the presentations that Professor Bill Megginson of the University of Oklahoma gave in New Zealand this week. Megginson is arguably the leading academic expert in the field.

It shows that annual privatisation revenues have fluctuated but are currently at record levels.

The EU and US debt crises will no doubt give further impetus to privatisation.  SOEs have been effectively eliminated in the United Kingdom.

Megginson lists the lessons of privatisation research as follows.

  • Sales improve financial and operating performance

        – impact on employment less clear-cut

        – generally also yields fiscal bonus for government

  • But, privatisation does not always ‘work’

        – and governments often try to retain real control

  • Investors have benefited from privatisation

        – both short and long-term returns are positive

  • Governments should sell assets as quickly as possible, for cash, to highest bidder

        – favour SIPs (Share Issue Privatisations), allow foreign purchases when possible.

Visit www.nzbr.org.nz to view the presentation Professor Megginson gave at a New Zealand Business Roundtable CEO Forum.

LOOKING INTO THE ABYSS

Last week’s Consilium hosted by the Centre for Independent Studies took a look into the abyss of sovereign default in Back from the Brink: Fiscal Disasters and Recoveries. “Kicking the can down the road” was definitely the phrase du jour on the topic, and among numerous memorable remarks were these from Czech Republic President Vaclav Klaus on Europe: “Europe is too heterogeneous for anyone to speak on its behalf” (how true) and “Capitalism without bankruptcy is like heaven without hell”. And from Oliver Hartwich: “Europe will have the next financial crisis and it will make the GFC of 2008 look like the good old days.”  Argentinian former politician, presidential contender and would-be reformer Ricardo Lopez Murphy spoke passionately about the difficulty and pain of adjustment. He entered politics in 1999 and was made Minister of Economy in 2001, but was fired by the president eight days later over his proposed fiscal austerity project.

Depressing stuff, and not surprisingly the session rapidly descended into an Eeyore-type gloomy patch about the debt crises. I felt obliged to ask why no one had mentioned the underlying problem, namely the intolerable government expenditure problems facing all the big welfare states (including New Zealand). The burdens of their entitlement programmes can only get worse with demographic trends, yet there is little evidence anywhere that governments are seriously grappling with them. It was pleasing to see the direction of the session shift somewhat. Vaclav Klaus was in strong agreement. As former 2025 Taskforce member, Trotter lecturer and smart labour market economist Judith Sloan said, the issue is all about the role of government :  if governments hand out free beer to people they will want more and will resist being deprived of it. Which is why the fiscal consolidation required on economic grounds in all these struggling welfare states is so very challenging politically. 

FRIDAY GRAPH: FREE MARKET ATTITUDES

Here is an interesting chart based on a survey by GlobeScan, a polling firm, and published in The Economist (online) on 6 April 2011.

The survey tested attitudes on the question of whether the free market was the best system for the world’s future.

As one would expect, the United States ranked fairly high, with 59% agreeing ‘strongly’ or ‘somewhat’ with the proposition.  But this was down from 80% when the question was first asked in 2002, perhaps influenced by the interventionist Bush and Obama administrations and the GFC (global financial crisis).

More interestingly, there was more support for the free market in China than in the United States.  Both China and Brazil have seen strong growth in their rankings in recent years.

A German economist suggested to me that Germany’s top ranking may have reflected a different ‘social market’ interpretation of the question.

Australia has a relatively low ranking and New Zealand was not covered.