Roger Kerr 1945 – 2011

A service to honour Roger’s life was held on Thursday 3 November at 2.30pm at Old St Paul’s in Wellington. 

A selection of public tributes to Roger:

Mary Kissel, Wall Street Journal’s Political Diary

Roger Kerr: An Appreciation by Richard A Epstein

George Mason University professor and Marginal Revolution blogger Tyler Cowen

Prime Minister John Key

The New Zealand Green Party

ACT New Zealand leader Don Brash

New Zealand Herald business columnist Fran O’Sullivan

Kiwiblog

Cactus Kate

Whale Oil

Homepaddock

Stephen Franks

You can share your own tributes and memories of Roger in the comments.


FRIDAY GRAPH: THE MYTH THAT NEW ZEALAND’S NET EXTERNAL INDEBTEDNESS IS A SAVINGS STORY

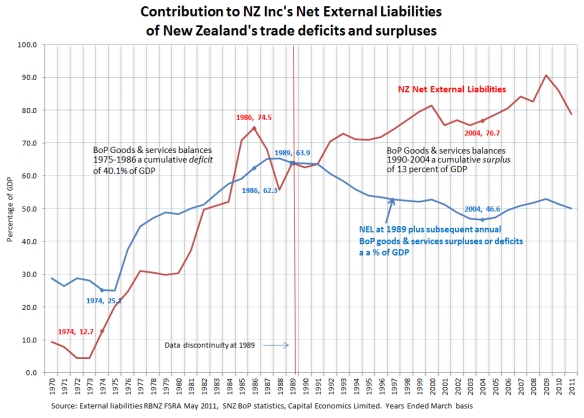
This week’s chart explores the contribution of the trade balance in the balance of payments to the evolution of New Zealand’s high external debt ratio.

The issue is significant because of the popular myth that the high net external debt ratio today results from a chronic inability of New Zealanders to save enough, for example, in the last two decades.  This, it is thought, is the cause of the chronic balance of payments current account deficits since 1974.  In reality, what was driving the deficits between around 1990 and 2004 was the cost of serving the net external debt built up by 1990.

This savings myth is bolstering the drive to force or subsidise today’s working age New Zealanders to save more.
Click to view larger

The red line on the chart shows New Zealand’s net external liabilities as a percentage of GDP.  It uses two time series published by the Reserve Bank of New Zealand in its May 2011 Financial Stability Report.  The first series, from 1972 to 1989 is an unofficial series.  The second series, from 1989 to 2011, is the official time series.  (Statistics New Zealand has since published revised statistics, but the RBNZ’s second series suffices for the purposes of this analysis.)

The first point to observe about the red line is that its level today is largely a legacy of the events that caused the 1984 foreign exchange crisis.  The ratio peaked at 74.5 percent in 1986 and is not vastly higher today.

The blue line in the chart plots how the net external debt to GDP ratio would have moved forward and backward through time from 1989 if the only factor operating had been the surplus or deficit in the trade balance of the balance of payments as a percentage of GDP in each successive year.

Focus first on the concurrent sharp rise in both the red and blue lines from the early 1970s to the late 1980s.  The unofficial estimate of the net external debt rose from 12.7 percent of GDP in 1974 to 63.9 percent in 1989, a rise of 51.2 percentage points of GDP.  That’s a massive contribution to today’s figure of around 80 percent.

The blue line shows the cumulative contribution to this rise of the large trade deficits (imports greater than exports) that occurred between 1975 and 1986. Summing the annual trade deficits as a percentage of GDP between 1975 and 1986 gives a cumulative deficit of 40.1 percent of GDP.  That’s a big number too.

It follows that the large trade deficits that followed New Zealand’s failure to adjust rapidly and flexibly to the 1973-74 oil shock may explain roughly half of the net external debt of 80 percent of GDP that is causing such widespread angst today. This was not a savings deficiency story (see below).  Instead the proximate reasons were the failure of the heavily controlled economy to respond adequately to the oil price shocks and the heavy overseas borrowing during this period to bolster the exchange rate and fund the large fiscal deficits.

Next, focus on the post-1989 period in the chart. The drop in the blue line occurs because, contrary to much popular belief, New Zealand ran surpluses overall in the balance of trade between 1990 and 2004.

It was only after 2004, when big government spending increases commenced, that the balance of trade returned to deficits, causing the blue line to lift slightly. The divergence between the blue and red lines after 1989 shows that the rise in net external liabilities from 63.9 percent of GDP in 1989 to 76.7 percent in 2004 was not a ‘spending beyond our means’ story.  To the contrary, domestic (consumption and investment) spending was lower than domestic production/income on average during this period.

Another reason for not unduly focusing on the savings aspect is that it is perfectly sensible to borrow overseas to fund some portion of domestic investment as long as the returns from that investment adequately cover the cost of borrowing, taking risk into account.

Savings rates are one thing, competitiveness is another. New Zealand’s exposed industries can lose competitiveness at any given savings ratio simply because of adverse international or domestic events, such as the big rise in government spending that occurred after 2004.

The loss of competitiveness after 2004 is a real concern from an economic management perspective, given the historically favourable export prices relative to import prices during this period.

Those who insist on portraying today’s high net external debt ratio as a savings deficiency story should be aware that New Zealand’s average gross national savings ratio was actually higher, at 19.6 percent of GDP, between 1972 and 1987 than it was between 1988 and 2004 when it averaged 17.2 percent of GDP.

Not shown in the chart is the second major factor affecting the ratio of net external liabilities to GDP.  This is the difference between the earnings rate payable on the net debt and the growth in GDP.  The former increases the numerator, the latter the denominator.  The rise in the red line in the chart after 1989, in conjunction with the fall in the blue line, suggests that the net earnings rate has exceeded the growth rate in GDP during this period.

Since New Zealand is too small to affect investors’ required return on capital, those who are concerned to see the ratio fall should be focusing on raising the rate of growth in GDP.  This needs to be done in conjunction with restoring competitiveness in the traded goods sector in order to stop the blue line from lifting unduly.

In summary, New Zealand’s high net external liabilities are largely a legacy of New Zealand’s pre-1984 ‘Polish shipyard’ economy (with apologies to post 1970s Poland).  They reflect past economic mismanagement and adverse oil price shocks, rather than any sudden change in national savings rates.  The reforms of the 1984-1991, including the move to a floating exchange rate, a disciplined monetary policy, and the progressive elimination of fiscal deficits, put an end to the chronic trade deficits of the earlier period.  Unhappily, the 2004-2008 loss of competitiveness and government spending discipline does not even have an adverse terms of trade excuse.

It could be worse than futile to try to penalise the current generation of workers for pre-1984 poor economic management by interfering with their consumption/savings decisions.  The focus instead should be on raising income growth, in part by raising external competitiveness.  After all, given the income gap with Australia and the number of New Zealanders voting with their feet, many would argue that raising the growth rate should be the focus even if the net external debt ratio were half what it is today.

A related point for those preoccupied with savings, as distinct from a higher savings ratio, is that higher growth means higher incomes and likely higher savings and consumption.

ASSORTED LINKS

STEVE JOBS: THE WORLD’S GREATEST PHILANTHROPIST

Writing in September this year for the Harvard Business Review, nonprofit sector expert Dan Pallotta argued that– contrary to widespread opinion – Steve Jobs was the world’s greatest philanthropist.

Pallotta begins:

A student at one of my talks on the non-profit sector asked if I could name a for-profit company that was making a difference on the scale that nonprofits do. I said I’d be hard-pressed to name one that wasn’t.

His reply highlights one of today’s great misconceptions.

Our youth are growing up with the strange notion that the only way to make a big difference in this world, or to be of service, is to work for a non-profit organization, or become the next Bill Gates and establish a private foundation, or to start some kind of “social enterprise,” often without any understanding of what that means.

Indeed Bill Gates has done much more   for society by improving the lives of hundreds of millions of people through the benefits derived from access to computers than he could ever hope to accomplish through his laudable personal philanthropic work.

The word philanthropy comes from the Greek philanthropos which comes from philein for “to love” and anthropos for “human being.” Philanthropy means love of humanity.

Which brings me to Steve Jobs.

Shortly after he returned to Apple in 1997 Jobs allegedly ended all of the company’s corporate philanthropy programs to cut expenses until the nearly bankrupt enterprise regained its footing. Some have claimed the programs were never reinstated.

A 2006 Wired article on Jobs, “Great Wealth Does Not Make a Great Man,” reported that even though his wealth was estimated at $3.3 billion, Jobs’s name did not appear on Giving USA’s list of gifts of $5 million or more for the previous four years, nor on another that list showing gifts of $1 million or more. (The article acknowledged that he could have been giving anonymously.)

The article took a cheap shot: “Jobs can’t even get behind causes that would seem to carry deep personal meaning…he is a cancer survivor. But unlike [Lance] Armstrong, Jobs has so far done little publicly to raise money or awareness for the disease.” It went on, “…he’s nothing more than a greedy capitalist who’s amassed an obscene fortune. It’s shameful…[Bill] Gates is much more deserving of Jobs’ rock star exaltation. In the same way, I admire Bono over Mick Jagger, and John Lennon over Elvis, because they spoke up about things bigger than their own celebrity.” Yes, but in part their own celebrity was connected to the things they spoke up about.

In a 1985 Playboy interview, Jobs acknowledged that it takes enormous time to give money away, and stated that, “in order to learn how to do something well, you have to fail sometimes…the problem with most philanthropy-there’s no measurement system.. you can really never measure whether you failed or succeeded…So…it’s really hard to get better.” He added that, “When I have some time, I’m going to start a public foundation.”

In 1986, he did, but closed it after 15 months. According to the man he hired to run it, “He clearly didn’t have the time.” Jobs’s friends told one reporter, “he figures he can do more good by expanding Apple.” And thank God for that.

Indeed, a typical business firm employs resources, such as labour and capital, and transforms them into goods and services desired by consumers – such as the almost ludicrously desirable iPod. Highly-profitable businesses such as Apple succeed in the process of cooperation and exchange that occurs through voluntary buyer and seller transactions in a competitive market economy that rewards and encourages innovation. Competition and the profit motive drove Apple’s extraordinary innovation, and the business has obviously been enormously successful.

What a loss to humanity it would have been if Jobs had dedicated the last 25 years of his life to figuring out how to give his billions away, instead of doing what he does best.

We’d still be waiting for a cell phone on which we could actually read e-mail and surf the web. “We” includes students, doctors, nurses, aid workers, charity leaders, social workers, and so on. It helps the blind read text and identify currency. It helps physicians improve their performance and surgeons improve their practice. It even helps charities raise money.

We’d be a decade or more away from the iPad, which has ushered in an era of reading electronically that promises to save a Sherwood Forest worth of trees and all of the energy associated with trucking them around. That’s just the beginning. Doctors are using the iPad to improve healthcare. It’s being used to lessen the symptoms of autism, to improve kids’ creativity, and to revolutionize medical training.

Of course Apple’s products have also improved business efficiency in many ways with positive knock-on effects for society, such as providing more efficient delivery of goods and services. We can now do our banking, shop for books, and even do  our weekly grocery shop, from our telephones.

And you can’t say someone else would have developed these things. No one until Jobs did, and the competitive devices that have come since have taken the entirety of their inspiration from his creation.

Without Steve Jobs we’d be years away from a user-friendly mechanism for getting digital music without stealing it, which means we’d still be producing hundreds of millions of CDs with plastic cases.

We would be without Pixar. There’s a sentence with an import inversely correlated to its length.

We would be without the 34,000 full-time jobs Apple has created, just within Apple, not to mention all of the manufacturing jobs it has created for those who would otherwise live in poverty.

How often this point is forgotten by anti-big business groups.

We would be without the wealth it has created for millions of Americans who have invested in the company.

We would be without video conferencing for the masses that actually works. Computers that don’t keep crashing. Who can estimate the value of the wasted time that didn’t get wasted?

We would be without a whole new way of thinking. About computers. Leadership. Business. Our very potential.

Last year Change.org wrote of Steve Jobs, “It’s high time the minimalist CEO became a magnanimous philanthropist.”

I’ve got news for you. He has been. What’s important is how we use our time on this earth, not how conspicuously we give our money away. What’s important is the energy and courage we are willing to expend reversing entropy, battling cynicism, suffering and challenging mediocre minds, staring down those who would trample our dreams, taking a stand for magic, and advancing the potential of the human race.

On these scores, the world has no greater philanthropist than Steve Jobs. If ever a man contributed to humanity, here he is.

Read the full article here.

Thomas Sowell, who gave the Business Roundtable Sir Ronald Trotter Lecture in 1996, also recently wrote about philanthropy and Steve Jobs. Read it here.

I blogged on how businesses gives back to society last week.

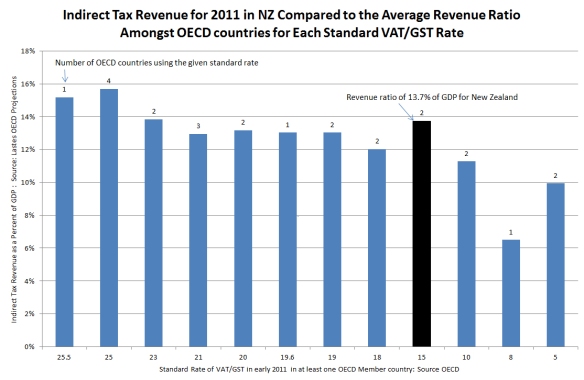
FRIDAY GRAPH: INDIRECT TAX REVENUES RELATIVE TO STANDARD RATES FOR VAT/GST

This week’s chart, prepared by Capital Economics Limited, suggests that New Zealand’s 15 percent broad-based GST could be giving it more revenue as a percentage of GDP than that typically being achieved by OECD member countries with standard rates for VAT/GST as high as 23 percent.   (Many countries have non-standard rates or exemptions that  reduce the revenue base.)  The statistics are not conclusive as they are based on all indirect tax revenues, not just revenues from VAT or GST.  The chart was motivated by this article in the OECD observer commending broad-based single-rate systems.

US INITIATIVE TO ACCEPT WARREN BUFFETT IRD LARGESSE

From time to time advocates of forcing people to pay more taxes say that they would be happy to pay more themselves. Well, why would the state not give those who want to pay more the opportunity to do so? There is no provision in New Zealand’s tax law for people to voluntarily pay more tax than that required. The issue is currently a live one in the United States given Warren Buffett’s recent declaration. The promoters of this proposal reckon that it could clear both Congressional Houses. If it does, there will be considerable interest in the level of voluntary payments of tax.

ASSORTED LINKS

CARBON PRICE COLLAPSE SHOULD REMIND US OF THE CARBON TAX ALTERNATIVE

The NZBR has long advocated a modest carbon tax for New Zealand at $5-$10 per tonne of CO2 rather than the current ETS for several reasons, one of which was that it would provide greater certainty for firms and households than the vagaries of prices struck in thin ETS markets. It was no surprise in 2008 to see the Australian Productivity Commission recommending much the same for Australia – see for example this 2008 media release here]

This Reuter report of extraordinary volatility this year in the international price for United Nations carbon credits is of interest in this context.  I leave it for readers to assess whether the reported record low is a welcome sign that it is much less costly to achieve given emissions targets than has been thought, or whether it reflects the inability of the authorities to indicate with any clarity how many credits will be issued.

HOW GOOD ARE OUR TEACHERS?

I’ve followed with interest the progress of an ongoing Los Angeles Times project investigating and reporting on the effectiveness of the city’s schools and teachers.

Since launching last year they’ve been analysing the last eight years’ maths and English test scores and an array of other classroom data, all of which has been helpfully collected and filed by the Los Angeles School District but never actually put to use.

Individual teachers, they found, make an impact on students’ performance three times greater than that of the schools they opt to attend. Students lucky enough to have teachers in the top 10 percent of effectiveness can expect to be 17 percentile points higher in English and 25 points higher in maths, on average, than those unfortunates stuck with teachers in the bottom 10 percent.

Interestingly, the Los Angeles Times’ analysis could find only a very small correlation between the level of experience, education and training teachers had and their ability to educate effectively. They found instead that good teachers varied hugely in age, style and personality, although they did all tend to set high standards, promote critical thinking and maintain a semblance of order in the classroom. 

The New Zealand public school system – like Los Angeles’ – ties teachers’ salaries to their levels of education and experience, factors easily gauged and processed by a central bureaucracy. Unfortunately, the factors that make some teachers great are not so easily computed, and as a result our system consistently fail to recognise and reward the teachers who actually provide the best value to students.

We have a pressing need for better quality educators for the thousands of children who are underachieving at schools throughout New Zealand.  As in most other professions, principals and parents/students, ie the managers and customers, are surely best placed to gauge the success and effectiveness of teachers. It’s high time individual schools and principals were given the freedom and responsibility to pay top rates to top-performing teachers and attract more, much-needed bright young talent to the profession.

FRIDAY GRAPH: OUR FISCAL DEFICIT MAKES ITALY LOOK LIKE A MODEL OF FISCAL PRUDENCE

Last week’s chart showed what a strong net public debt position New Zealand is in, compared to Italy and most other OECD countries.  

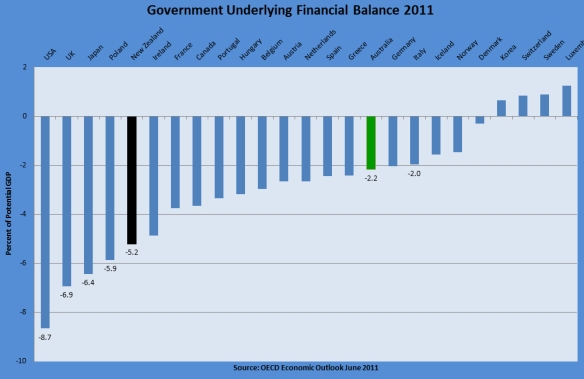
This week’s chart shows that New Zealand is running one of the largest underlying fiscal deficits in the OECD, as a percentage of GDP.

Specifically, New Zealand’s cyclically-adjusted financial balance for 2011 is projected to be minus 5.2 percent of GDP, which is the 5th highest deficit in the OECD, far higher than Australia’s and makes Italy today look like a model of fiscal prudence compared to New Zealand!   For 2012 New Zealand’s projected underlying financial deficit of 5.4 percent of GDP would be the 3rd highest in the OECD.

Much the same rankings for New Zealand for 2011 and 2012 apply for the OECD’s other financial balance indicators – the cyclically-adjusted balance (fourth in both years) and the primary balance (second highest deficit in 2011, no doubt in part because of the Christchurch earthquake, and third highest in 2012).

New Zealand’s underlying fiscal deficit problem arises from the spending excesses post-2005, and the unwillingness of the current government to address the problem more decisively. The latter issue is of particular concern with the government lacking the political will to implement even such obviously necessary measures as eliminating interest-free student loans and raising the age of eligibility for New Zealand Superannuation.